

Metrics
Nodit Metrics is a developer tool that provides usage analytics for Nodit APIs, including request success and failure counts, error statistics, CU consumption, and average response time.
How to use the Nodit Metrics
After logging in to the Nodit Console, click [Projects] in the left navigation menu.
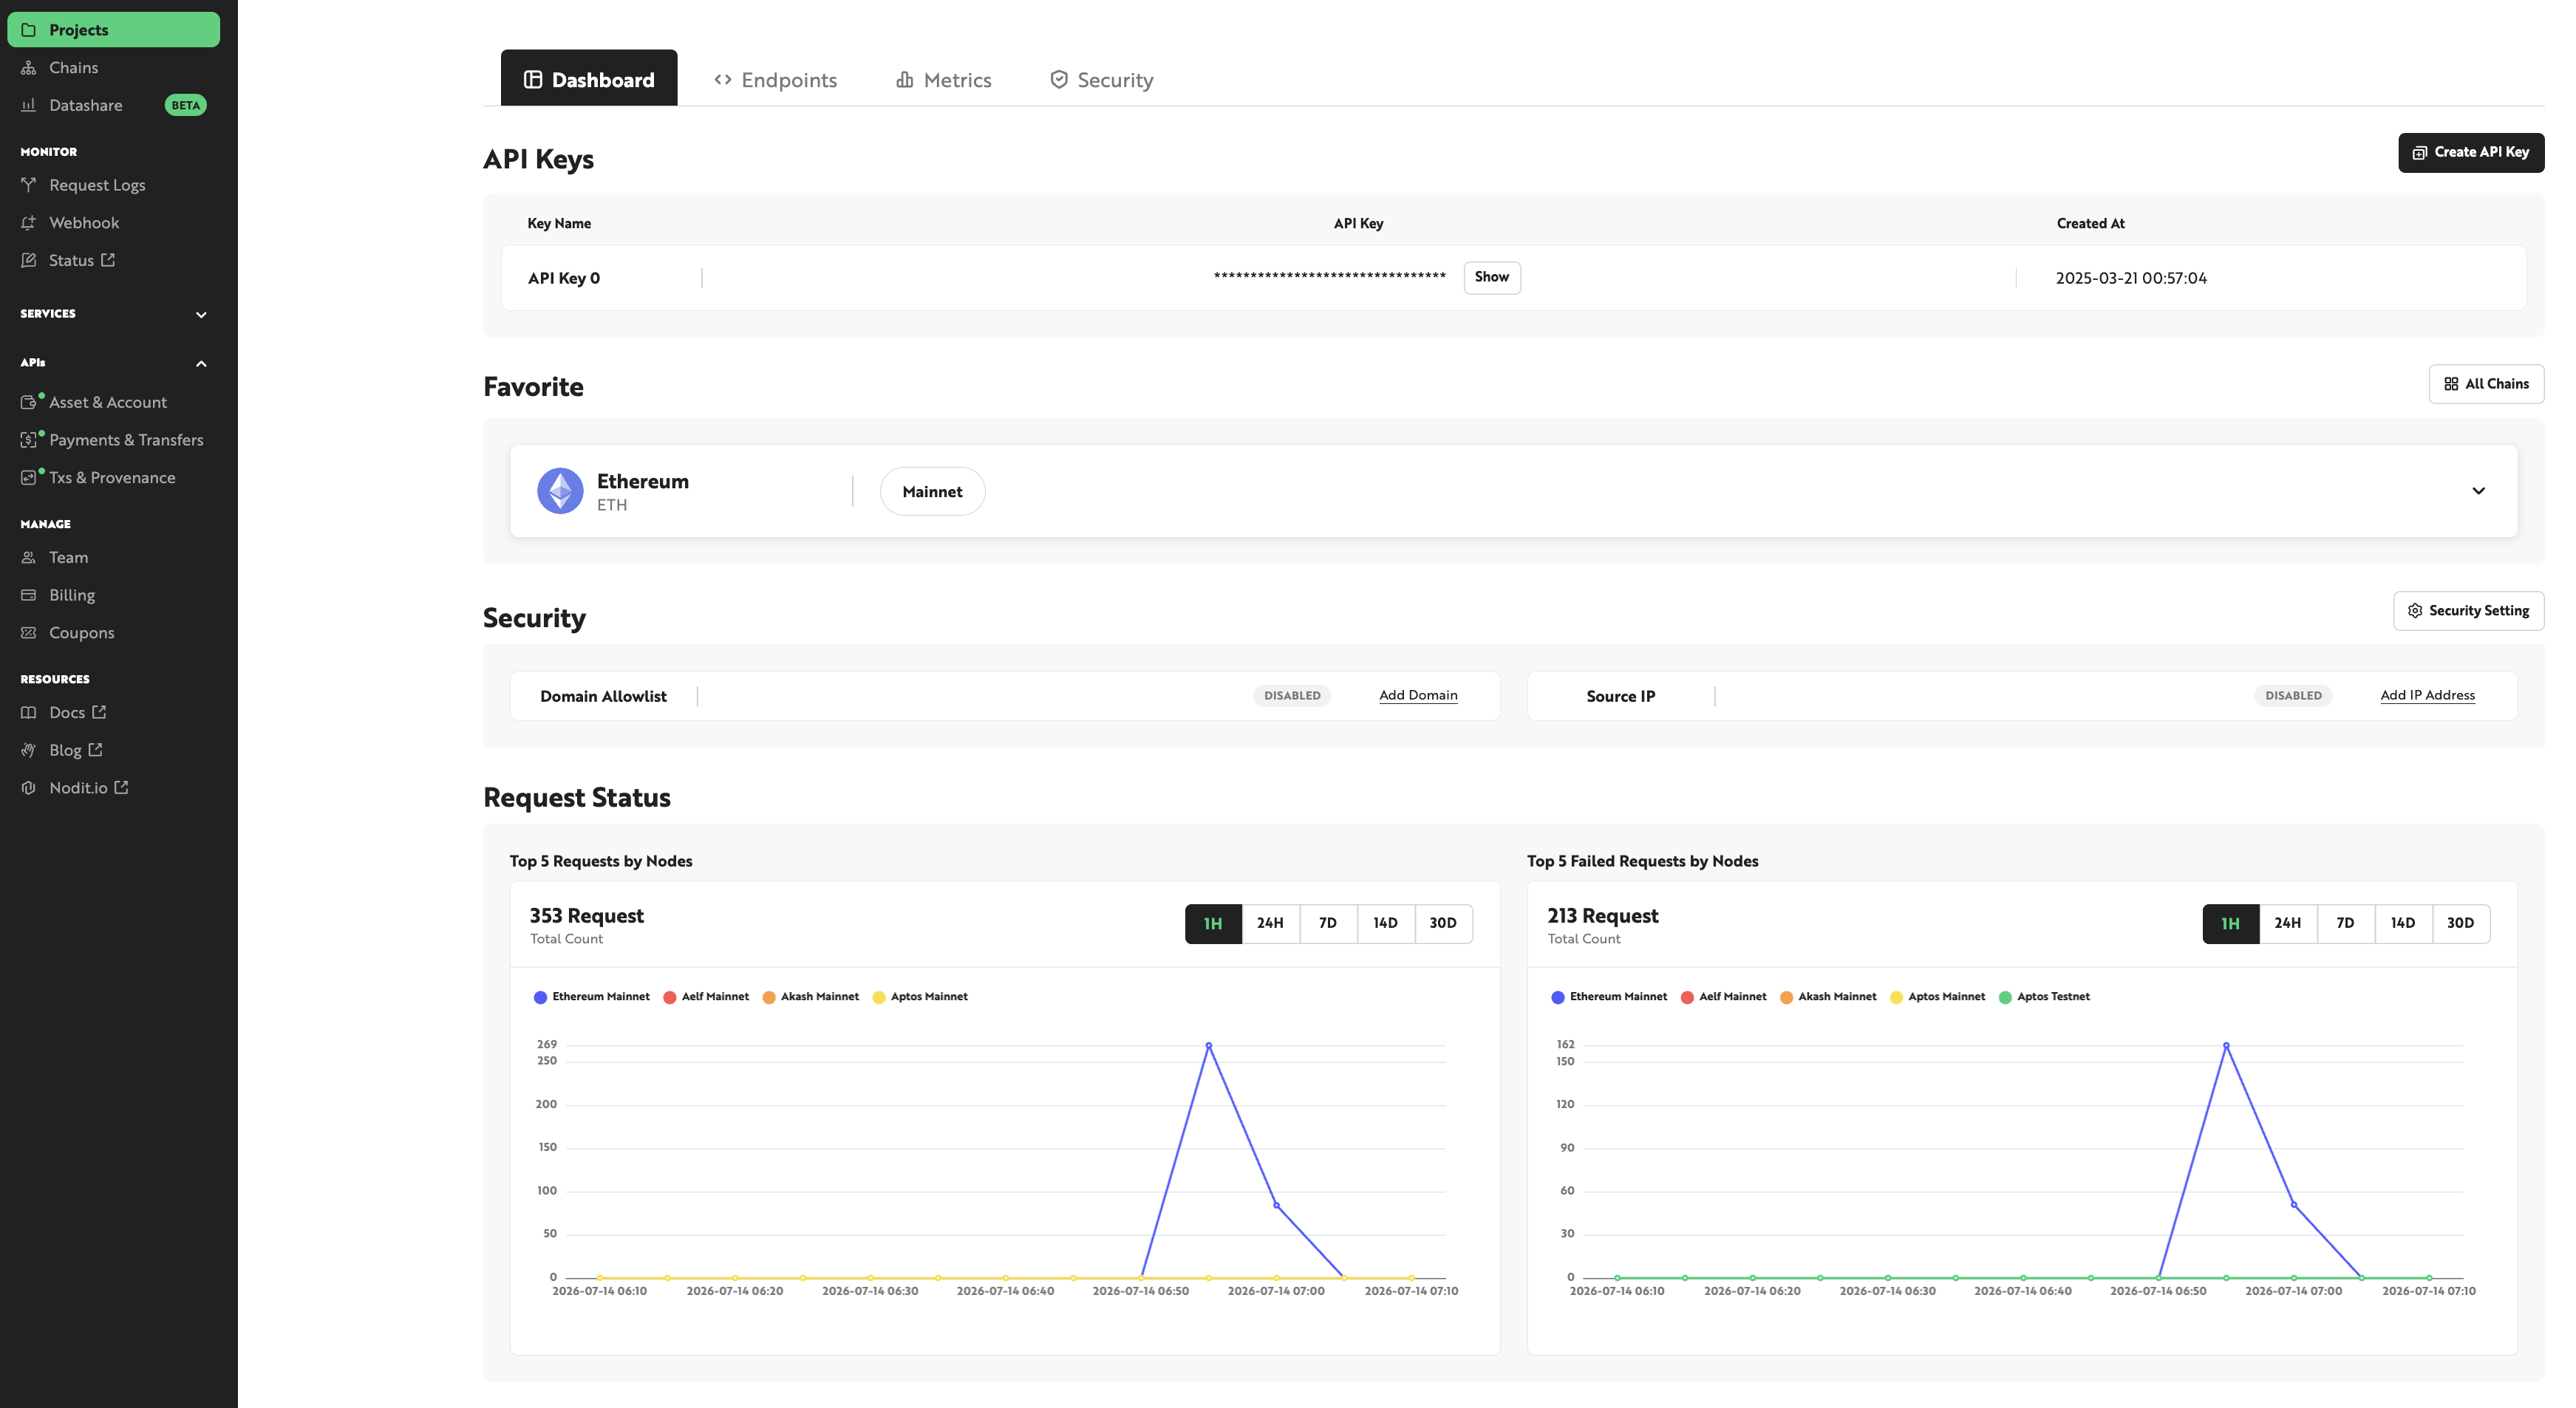
Click the [Metrics] tab to open Nodit Metrics.
Key Features
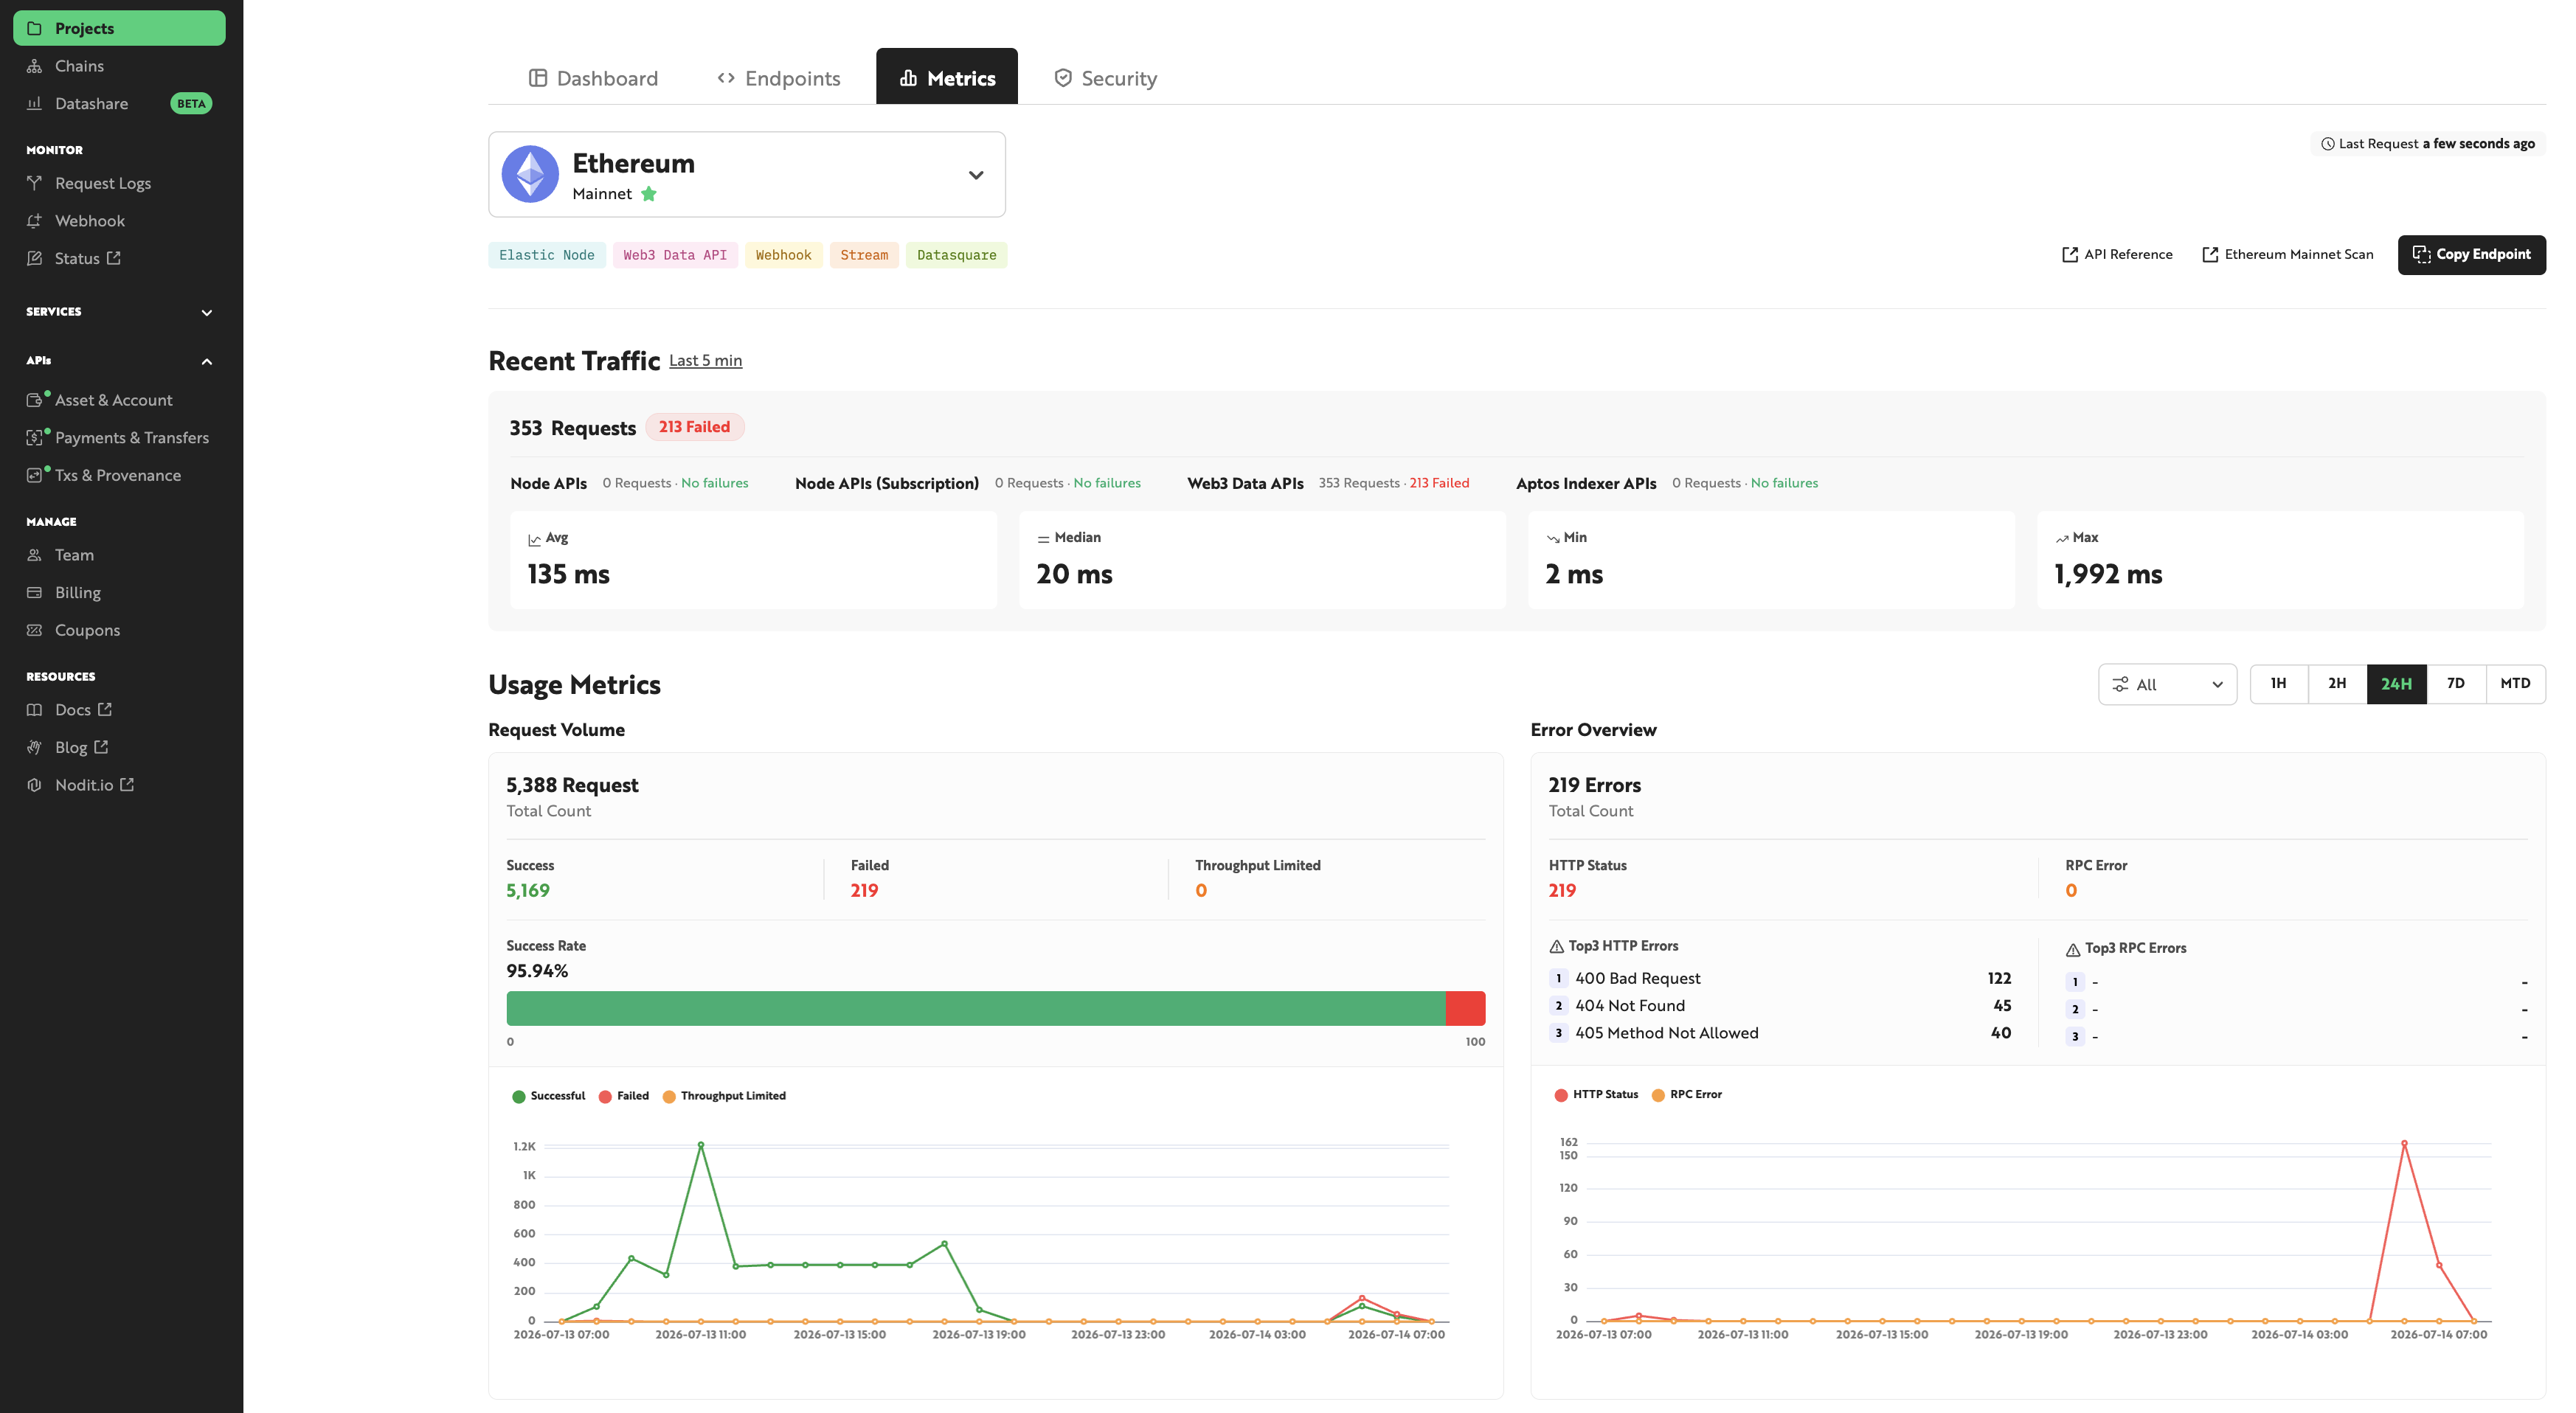
Nodit Metrics provides Recent Traffic for monitoring the last 5 minutes of traffic, and Usage Metrics for analyzing usage statistics over a selected time period.
Recent Traffic
Provides traffic statistics for the last 5 minutes on the selected chain and network. You can view total request and failure counts, per-API request and failure counts, and response time statistics for all requests.

- Avg: Average response time across all requests
- Median: Median response time across all requests
- Min: Minimum response time across all requests
- Max: Maximum response time across all requests
Usage Metrics
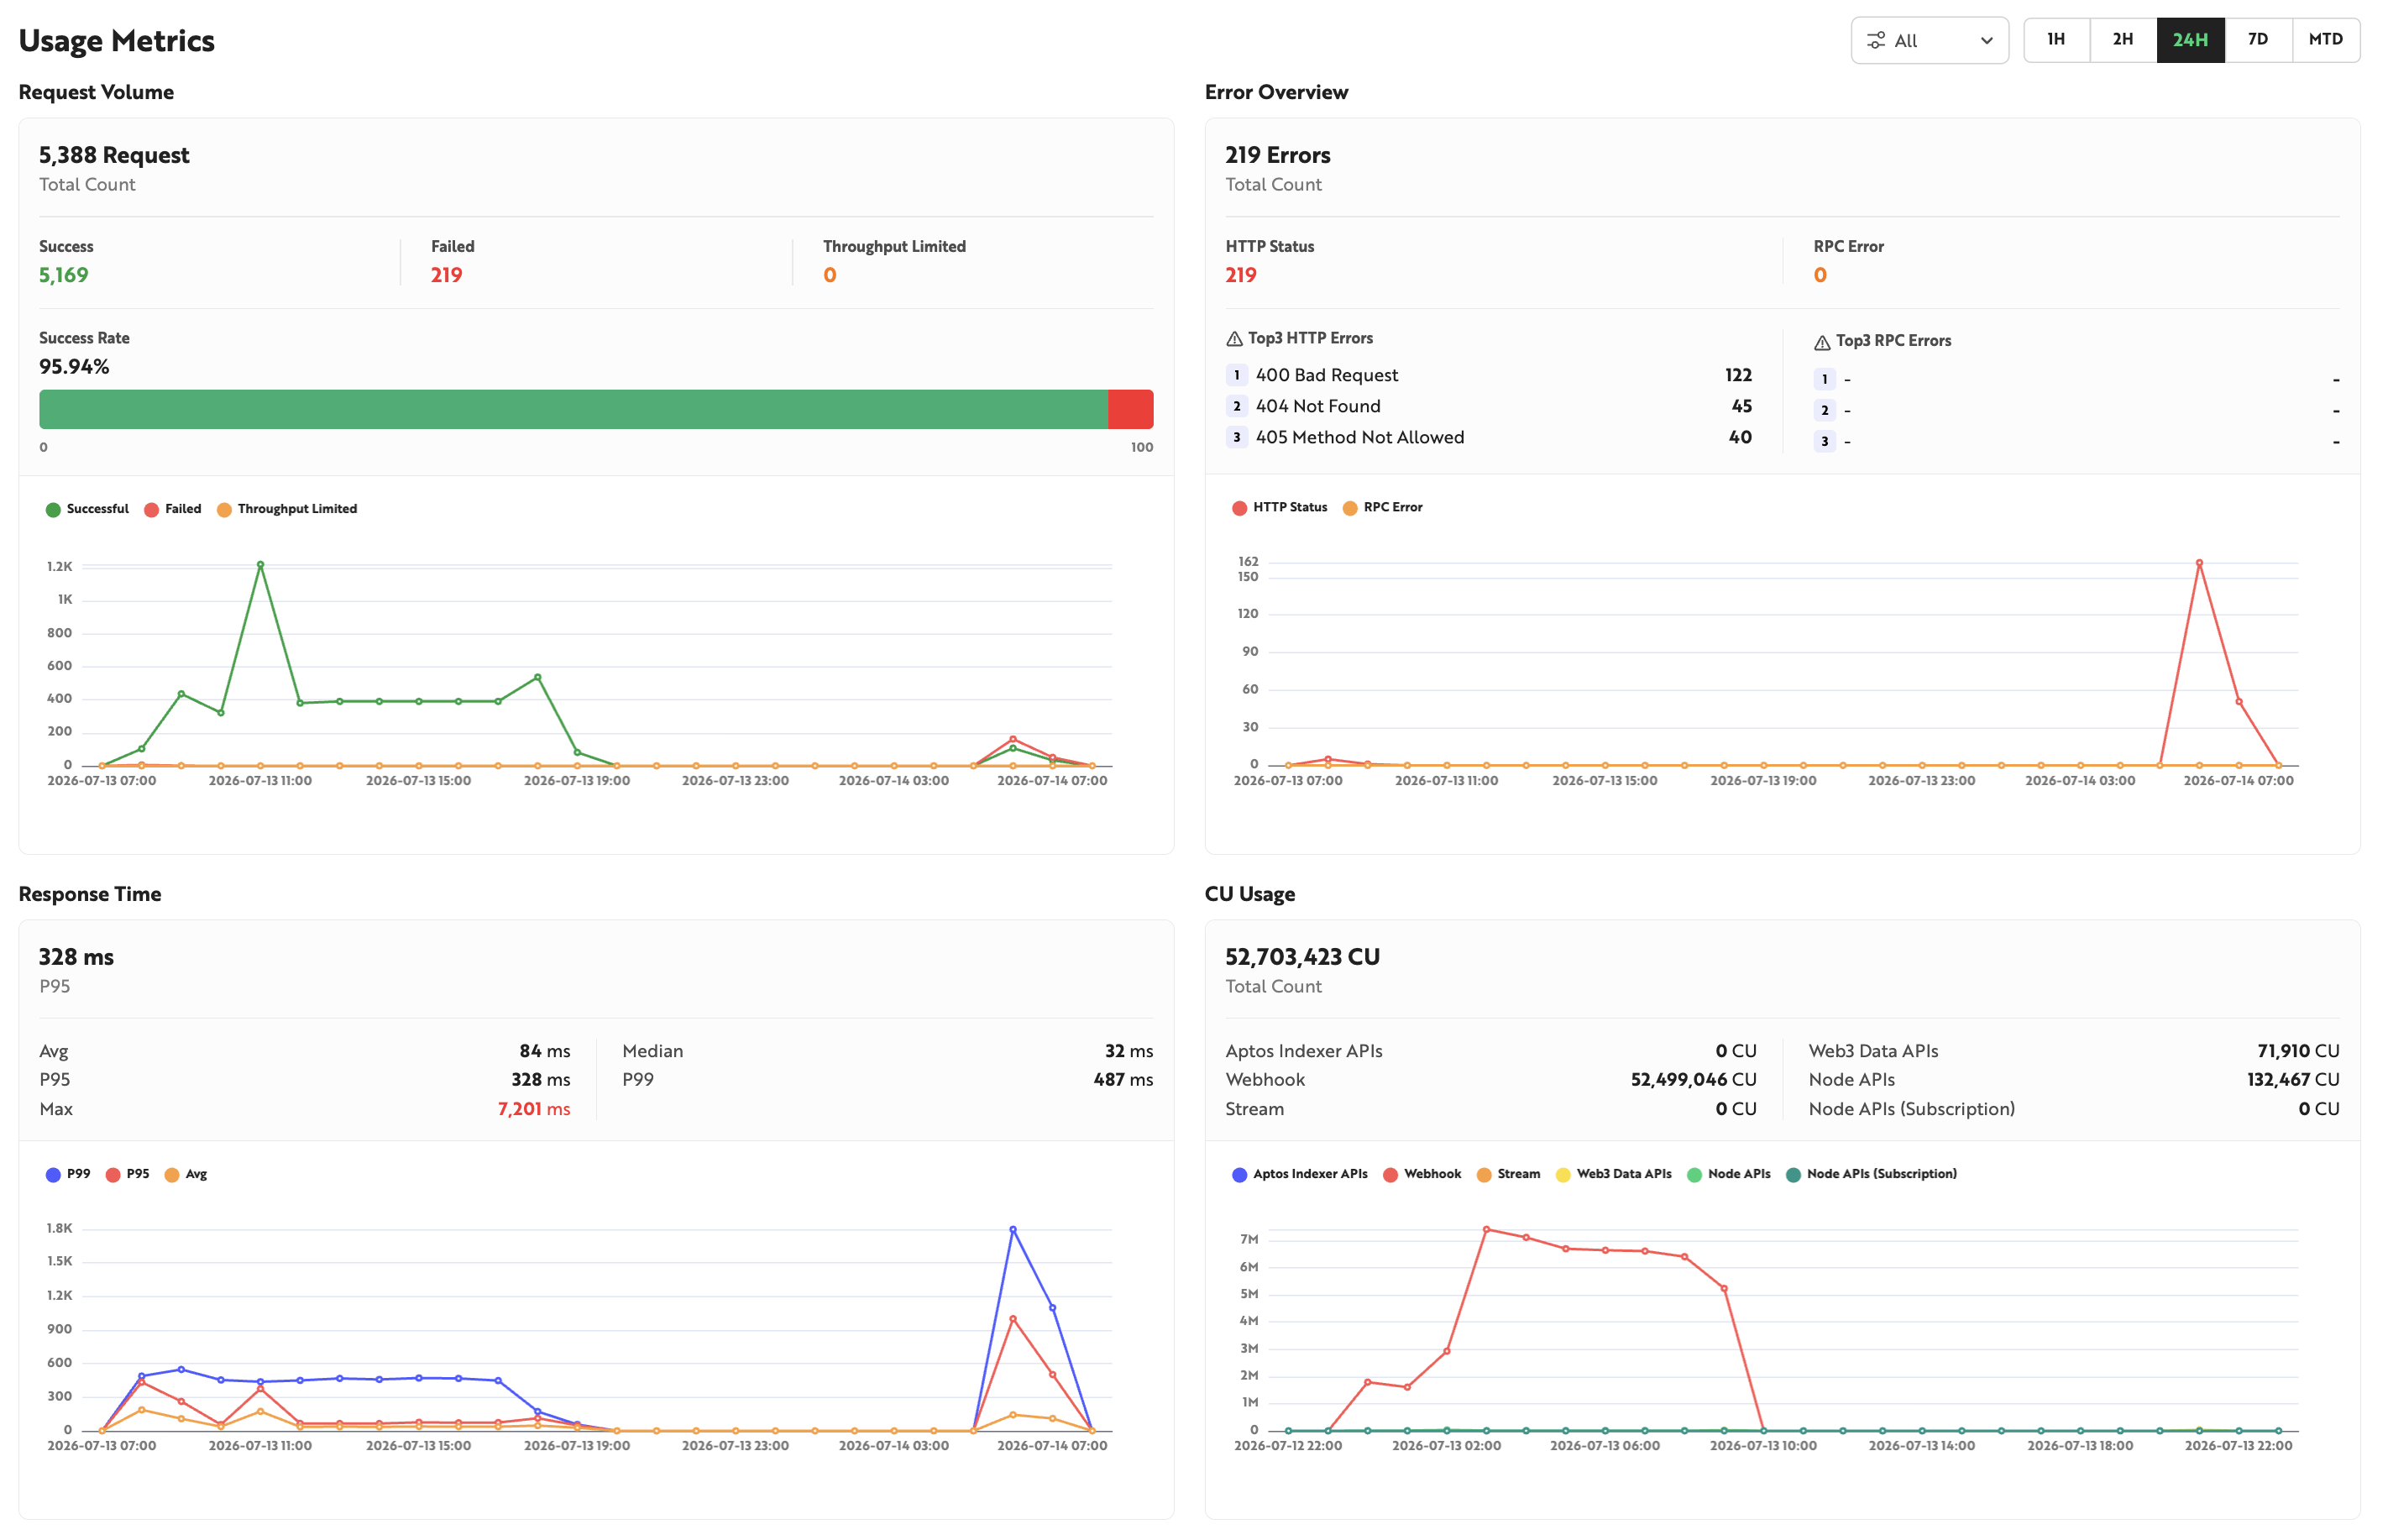
Provides usage statistics by time period for the selected chain and network. Select one of the following periods — 1 hour, 2 hours, 24 hours, 7 days, or the current month (1st to 31st) — to view usage statistics for that range. You can also filter by a specific API to narrow the results. The statistics available for each section are as follows.
Request Volume
Displays the total request count, success and failure counts and rates, and the number of requests that hit the Throughput limit for the selected chain and network over the configured period.
Error Overview
Displays the total number of errors that occurred during API calls over the configured period, along with the top 3 most frequent errors by type.
Response Time
Provides response time statistics for API requests over the configured period.
- Avg: Average response time
- Median: Median response time
- P95: 95% of all responses complete within this time.
- P99: 99% of all responses complete within this time.
- Max: Maximum response time
CU Usage
Breaks down CU consumption by API over the configured period. Use CU Usage to understand which APIs consume the most CU and how much.